More on Error Monitor
July 01, 2011 | Posted by Owner | Filed under documents, internet
Eris error monitor is a software which manages exceptions thrown in the applications.
Eris error monitor is known as being unique and first in its area,
There is not any other monitoring tool that provides so much data and source code based code analysis.
It is designed and developed as a result of long term search and hard working.
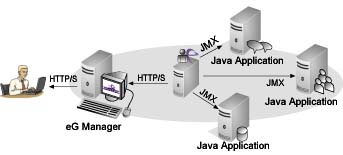
There are two basic parts in Eris error monitoring,
the first part collects data which is fetched from application.
The second part displays it on a web based GUI.
There is a possibility that not all the exceptions are caught by programmatically
If the exceptions are not caught and good level of information is not provided about the exception
fixing the error takes a long time and it is not very easy to debug on production systems.
Eris error monitor is a framework which handles all the exceptions thrown in a application
without modifying your source code and system classes.
Moreover it does not reduce application performance. On the other hand,
There is no database and setup it works all on the platforms easily.
It stores the data directly on file system which doesn't reduce performance,
at any time the storage location can be replaced.
Eris Error Monitor Execution : Eris error monitor libraries are loaded
when the application server starts and they listens the exceptions that may occur in the application.
When an exception is occurred the information is stored on the disk and an alert mechanism is worked
at the same time.
The stored information are then read for online screens.
Eris error monitor logs all the exceptions even if you dont have any try catch statement.
You can observe the exceptions historically by using Eris error monitor web console.
it draws statistical diagrams regarding class and methods by means of this,
you can decide the classes and methods that are causing the exceptions according to their exception counts.
It is possible to sort the result table ascending and descending.
The Benefits of Eris Error Monitor :
There are many advantages of using error monitor,
You can fix the application bugs easily.
Fixing the errors in a short time creates customer satisfaction.
You have the chance of upgrading your application in terms of performance and stability.
It helps development, test and service departments to detect the application problems without spending effort.
Eris error monitor saves you time and money.
You can manage all of your application Exceptions.
You can monitor user actions on the application.
You can observe general application performance and detect leaks.
You can get information about the user screen usage.
it is like a magic in the world of java applications. It lets developers to find out
application errors in a very short time without spending so much effort.
Furthermore, maintenance of applications become very easy and customer satisfaction increases accordingly.
 The basic benefits of using Eris error monitor :
When an exception is occurred error monitor logs the exception class, method, line number,
exception definition and execution flow.
Even if the exception is not defined in class file the exception can be caught via Eris error monitor and
Very detailed exception trace is stored like
exception time, exception class, method & line, exception long description.
The data in the exception class is stored for instance, global variables ,method variables
and persistent class properties are logged along with the stack trace.
Developer can observe the data which causes the exception easily.
Along with session and request variables the objects in the classes are stored
and they are viewed as tree style.
Clear case version system is supported by error monitor.
It is possible to observe the last 5 versions of the classes in which the exception is thrown,
you can switch to any class even if there is no exception to view the clear case data.
Developer name,status,check in date, version number and comment belonging to the classes can be observed.
The log detail in others words object detail level can be configured at configuration screen this enables
the developers to collect more or less data when an exception is occurred.
When an exception is raised it is possible to trace the stack to view the class and methods
with the execution line.
When an exception is raised in a class, Eris error monitor displays the
global variables and objects with their values.
It is also possible to see object tree with the values.
The runtime data belonging to the method in which the exception is raised is displayed by means of
error monitor as it is in global variables.
When an exception occurs also alert mechanism is available it may appear on user screen or a warning email can
be sent to developer. This facilities are also configurable for instance,
A developer can be defined to be mailed when an exception is raised in a specific package.
Source code is displayed and the line where the exception is raised is colored in this way it is very easy
for a developer to decide on where and how and exception is raised.
Source code presentation of exception makes the color of exception line lighter in the source code.
Source code analyzer displays the class source and lets the user jump between classes and methods.
This enables the person who has the ability of code reader to use error monitor as a software development IDE.
Exceptions are archived and they can be reached at any time. You can toggle between days easily.
A paging and printing system enables displaying a specific portion of exceptions and printing them.
The Class and method based exceptions can be analysis graphically
Classes can be compared according to their exception frequency.
Class methods are compared with others methods according to their exception frequency.
Toggle between days and date search are also available.
The basic benefits of using Eris error monitor :
When an exception is occurred error monitor logs the exception class, method, line number,
exception definition and execution flow.
Even if the exception is not defined in class file the exception can be caught via Eris error monitor and
Very detailed exception trace is stored like
exception time, exception class, method & line, exception long description.
The data in the exception class is stored for instance, global variables ,method variables
and persistent class properties are logged along with the stack trace.
Developer can observe the data which causes the exception easily.
Along with session and request variables the objects in the classes are stored
and they are viewed as tree style.
Clear case version system is supported by error monitor.
It is possible to observe the last 5 versions of the classes in which the exception is thrown,
you can switch to any class even if there is no exception to view the clear case data.
Developer name,status,check in date, version number and comment belonging to the classes can be observed.
The log detail in others words object detail level can be configured at configuration screen this enables
the developers to collect more or less data when an exception is occurred.
When an exception is raised it is possible to trace the stack to view the class and methods
with the execution line.
When an exception is raised in a class, Eris error monitor displays the
global variables and objects with their values.
It is also possible to see object tree with the values.
The runtime data belonging to the method in which the exception is raised is displayed by means of
error monitor as it is in global variables.
When an exception occurs also alert mechanism is available it may appear on user screen or a warning email can
be sent to developer. This facilities are also configurable for instance,
A developer can be defined to be mailed when an exception is raised in a specific package.
Source code is displayed and the line where the exception is raised is colored in this way it is very easy
for a developer to decide on where and how and exception is raised.
Source code presentation of exception makes the color of exception line lighter in the source code.
Source code analyzer displays the class source and lets the user jump between classes and methods.
This enables the person who has the ability of code reader to use error monitor as a software development IDE.
Exceptions are archived and they can be reached at any time. You can toggle between days easily.
A paging and printing system enables displaying a specific portion of exceptions and printing them.
The Class and method based exceptions can be analysis graphically
Classes can be compared according to their exception frequency.
Class methods are compared with others methods according to their exception frequency.
Toggle between days and date search are also available.
Back