Detects slow performance & reports leaks. calculates execution time for each request

More on Performance Monitor

July 01, 2011  |  Posted by Owner  |  Filed under documents, internet
image

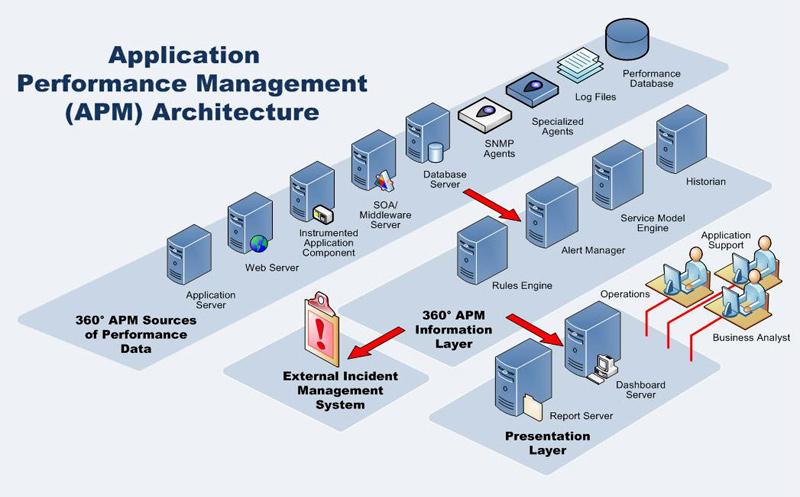
Eris performance monitor has been developed to detect the performance leaks and bottlenecks in the codes It monitors all the code blocks calculates the amount of time which is elapsed during the execution and analyze the results. It doesn't only finds out the performance leaks but also provides all the runtime data that may cause long running processes. Regarding the database transactions and queries, Eris performance monitor calculates the execution time for each transaction along with its runtime parameters.

Businesses rely on various applications to make their employees and customers productive. Hence application performance issues can impact the business by causing decline in customer satisfaction, reduction in employee productivity and may even affect brand reputation. It is hence essential for the IT Team to deliver applications that meet end user satisfaction. It Remotely monitors the uptime and performance of business-critical web applications that involves multiple web transactions such as an online shopping cart, etc. and gets instant notifications when there are problems with your application such as connectivity problems, slow page load time, or content errors. When an end user triggers an event on the application like clicking on a button to start a request on the server. Eris performance monitoring traces the code execution. You can observe all the classes and methods execution between user request and server response regarding the execution order. In addition to this,You can view the executed lines in the classes, and can progress on the executed lines as if you are debugging the class. This is very helpful If there is no error in the system but something works wrong it is possible to debug the executed lines so that which part of the code is executed. Beside this, you can even see the execution performance in miliseconds between the class lines in the methods.

You can view the source code between the lines regarding the execution performance. Eris performance monitor helps you to detect the leaks in the application by observing the piece of code that causes the slow performance. Furthermore,you can view the method execution order in the class. It is possible to view the class runtime object size by using performance monitor, this is important if there is a heap size dump in the system, at this time you may observe the total class runtime object size. If there is no error in the system, and you wish to see the runtime class data in the application you can monitor any user events and can see the formed data during the method execution process. By using monitoring web console you can view the total time in miliseconds between the user request and server response and you can compare the requests.

You can observe the total application performance for those who are defined to be monitored. It is possible to view the class usage count and average execution time for the application users. You can also view methods that are belonging to any class as it is like class viewing you can observe methods usage counts and total average time. You can also view usage count and performance of the code lines belonging to any method. If you wish, you can see the source code executed between any code lines. It is possible to sort the result table ascending and descending.

image

  • This function is very interesting in java world, if there is no error in the system but a developer is interested in which classes and class lines are executed as a result of a specific process it is possible for him to observe the executed lines like debugging the application.
  • The classes are displayed and ordered according to their execution sequence.
  • When a class is selected the executed lines that belongs to selected class are displayed colored in the class source file.
  • You can toggle between lines by the control buttons to debug the application to find observe the executed lines.
  • You can view all the execution by clicking on animate button, in other words, the execution of the codes may be simulated.
  • Debugger module can be configured to enable monitoring for some client requests, this configuration prevents the performance load on the legacy application.
  • If there is no error in the system but it operates very slow it is possible to view where the process is bottle necked. The graphics belonging to client requests gives the idea of slow performance, then the detail analysis on the class method execution plans find out the code block along with its runtime parameter values so that the problem is fixed easily.
  • The reports display the total execution time and user request belonging to a specific process. it is possible to trace all the user execution results in detail, that is to say, the user actions on the system can be monitored with the execution performance values.
  • User name or client address belongs to a process can be modified so that the monitoring works on some specific requests.
  • All the class executions are ordered according the their execution sequence for each class and method the execution time is displayed. All the detailed execution flow is displayed it is possible to view the class methods according to their execution sequence.
  • Classes execution time and their percent among other classes are displayed. In the detailed class view the methods belonging to a selected class can be displayed with its total execution time and percent among other methods.
  • If the user clicks on a method the code blocks in that method like lines are displayed along with the execution time between them. This means that in the method the code between the lines is executed in the displayed time. If the user clicks on the view code between lines link, the source code between lines are displayed as well to give an idea about the performance leak.
  • Back

    Eris Technology

    pix pix pix pix pix pix

    As an IT systems integrator, we use a unique methodology that focuses on up front strategy, fast and effective implementation and knowledge transfer to ensure long-term success. Leveraging a proprietary four part process, our experts diagnose your challenges, develop an appropriate solution, deploy it quickly and provide the detailed documentation you need to help ensure ongoing success. What's more, we offer top-of-the-line customer support.

    Our Mission

    Our company has emerged in the market to bring a new approach to IT solutions. Eris solutions are becoming ever more challenging as technical change accelerates. We are determined to take the lead in developing tools and techniques to meet the needs of developers and testers. We provide a combination of openness and extensibility, powerful functionality and wide technical coverage with excellent support. This is a compelling offering when compared to both commercial and Open Source alternatives. Eris is built around technically accomplished and highly motivated product development and service teams. Our approach is flexible, friendly and responsive

    Why Eris

    Our developers and support team work directly with customers to ensure innovative product design and rapid problem solving. Flexibility and extensibility are among our core software design principles, creating elegant and cost-effective solutions that work in the real world. We believe that first class services are vital. We know that customers have different approaches to testing and we provide tailored services from simple tool support to managed testing services. We are committed to realistic costs and sensible licensing we wish to build long term relationships with customers who continue to benefit from our solutions.