More on Loader
July 01, 2011 | Posted by Owner | Filed under documents, internet
The goal of Eris loader testing tool is not to find bugs,
but to eliminate bottlenecks and establish a baseline for future regression testing.
To conduct performance testing is to engage in a carefully controlled process of measurement and analysis.
Ideally, the software under test is already stable enough so that this process can proceed smoothly.
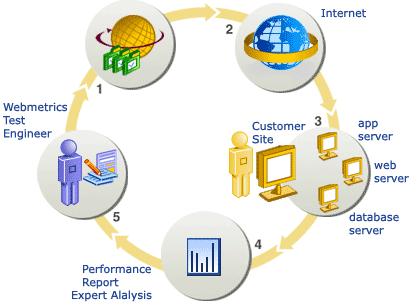
Eris loader consists of two main modules, the first one is recorder which works on the server side
it listens all the end user actions and executes the commands sent by client application.
loader recorder has also a client module which creates test scenarios, it wraps the project web pages and records all the user steps
when the user finishes his task, the recorded data is saved as a new scenario.
In addition to this, recorder collects statistical information about the scenario execution to report it in the result analysis.
The second module of the Eris loader works on the client machine to perform the test cases consist of test scenarios.
It has the following features :
Preparing Scenarios : As it is mentioned before, it creates test scenarios by using the recorder which is installed on the project server.
the test analyzer can prepare any scenario on the application project, supposing that the scenario is formed from many business flows
states and transactions, the recorder saves all the steps to be used in the test case execution plans.
Modifying Scenarios : The scenarios may have many parameters to be posted from client to server, this parameters decide on the
test execution plan and the desired transactions.
Regarding the possible constraints on the back-end system, you may not execute the transactions with the same input data
When the test stars many virtual users are created to perform the scenarios, but they should not use the same input, otherwise
the test execution will fail.
Eris loader lets the test analyzer to edit all the scenarios parameters so that the test execution will be done as real as it is like
on the live system.
All the posted parameters are listed for each step of the interaction with the server, the user can set an array of parameter values
for a single parameter definition, in other words, the parameter values are used for each scenario execution, therefore the values are
defined as an array.
On the other hand, if any of the parameter name is modified as a result of project deployment, the test analyzer may want to reuse the
test scenario, that is why, the parameter name should be also modified, Eris loader enables even the parameter name modification
to be used in the scenario executions.
Preparing Test Cases : A test case is prepared to observe the server response when many users perform
the scenarios which are prepared before.
The test analyzer chooses test scenarios with the number of users, scenario execution repeat count
and waiting time between repeats to create a test case.
A test case may be formed of many scenarios and virtual users.
 Running Test Cases : After preparing test cases, it is ready to run any of them.
When run button is clicked all the virtual users are created to execute the scenarios.
The virtual users executes all the steps formed in a scenario, the status of the executions is
displayed on the screen while the test is in progress.
At any time the test analyzer can stop or suspend the test.
when the test is completed all the execution result are stored for each virtual user.
Analyzing Results : While the test is in progress the response time of the scenario executions can be observed at realtime.
Furthermore, execution status and server response times of all the virtual users are also displayed on the GUI.
Considering the test results the following graphics are generated :
Scenario Comparison Graph : The average response time of each scenario are compared in this graphic. Supposing that many virtual users executed
a scenario, the average server response time of all the virtual users are compared so as to decide on the process performance.
Scenario Execution Flow Graph : During the execution of a scenario,
the average response time is changed in time.
When the load on the system increases the average server response time increases as well
This graphic illustrates the cut off points.
Scenario Virtual Users Graph : For each scenario all the virtual users and their server response times are displayed
on this graphic.
Virtual User Step Execution Graph: When a virtual user for an executed scenario is selected, all the step execution detail is
displayed on this graphic. By means of this, in which steps, in other words, the client interaction with the server, the
response time increases can be observed on the graphic.
In addition to this, the server and client execution times are displayed separately on the graphic,
to perform a scenario, many steps are executed,
the time which passes on the server and client sides are crucial considering the slow performance.
This helps to find out the performance leaks.
Original User Step Execution Graph: When the scenario is created by the test analyzer all the step execution details are also recorded,
this values are compared with the virtual users to observe the server behaviour against the single user execution
while the load on the system increases.
Step Execution Data: When a step execution of a scenario is selected, all the data exchanged with the server at this step
is displayed with the response times which passes on the server and client sides.
if there is a performance problem at a step, data analyzing may help to find out the cause of the slow execution.
Client request, header,cookie parameters and server response html data are displayed on the GUI along with the
execution metrics.
Running Test Cases : After preparing test cases, it is ready to run any of them.
When run button is clicked all the virtual users are created to execute the scenarios.
The virtual users executes all the steps formed in a scenario, the status of the executions is
displayed on the screen while the test is in progress.
At any time the test analyzer can stop or suspend the test.
when the test is completed all the execution result are stored for each virtual user.
Analyzing Results : While the test is in progress the response time of the scenario executions can be observed at realtime.
Furthermore, execution status and server response times of all the virtual users are also displayed on the GUI.
Considering the test results the following graphics are generated :
Scenario Comparison Graph : The average response time of each scenario are compared in this graphic. Supposing that many virtual users executed
a scenario, the average server response time of all the virtual users are compared so as to decide on the process performance.
Scenario Execution Flow Graph : During the execution of a scenario,
the average response time is changed in time.
When the load on the system increases the average server response time increases as well
This graphic illustrates the cut off points.
Scenario Virtual Users Graph : For each scenario all the virtual users and their server response times are displayed
on this graphic.
Virtual User Step Execution Graph: When a virtual user for an executed scenario is selected, all the step execution detail is
displayed on this graphic. By means of this, in which steps, in other words, the client interaction with the server, the
response time increases can be observed on the graphic.
In addition to this, the server and client execution times are displayed separately on the graphic,
to perform a scenario, many steps are executed,
the time which passes on the server and client sides are crucial considering the slow performance.
This helps to find out the performance leaks.
Original User Step Execution Graph: When the scenario is created by the test analyzer all the step execution details are also recorded,
this values are compared with the virtual users to observe the server behaviour against the single user execution
while the load on the system increases.
Step Execution Data: When a step execution of a scenario is selected, all the data exchanged with the server at this step
is displayed with the response times which passes on the server and client sides.
if there is a performance problem at a step, data analyzing may help to find out the cause of the slow execution.
Client request, header,cookie parameters and server response html data are displayed on the GUI along with the
execution metrics.
Back